Microsoft Excel 2010 - Presenting Data Using Charts
- Product ID
- soniepdu_vod
- Training Time ?
- 66 to 74 minutes
- Language(s)
- English
- Video Format
- High Definition
- Required Plugins
- None
- Number of Lessons
- 9
- Quiz Questions
- 8
- Question Feedback
- Wrong Answer Remediation
- Lesson Bookmarking
- Downloadable Resources


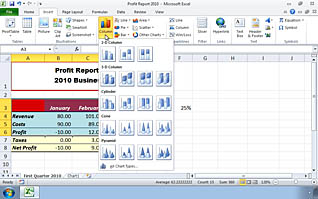
This training program reviews ways to create, modify, and format charts to present professional information in a more visually appealing way. By showing the viewer how to create a chart through the Microsoft Excel 2010 platform, this training demonstrates steps to improve visual aspects of your business.
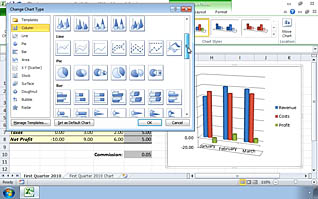
Because creating charts and graphs can be somewhat tedious at times, the program uses a step-by-step formatting guide to show the viewer how to create several forms of charts. Sizing and resizing charts in any style is looked at. This video shows the viewer how to modify already existing charts, so business professionals can improve material they already have. By formatting the charts, data ranges, axis, and labels, the viewer is then able to create an organized version that is both visually appealing and professional.
This training is a must for anyone working closely with data or charts on a daily basis. A short quiz follows the training video to ensure the viewer has understood all key concepts.
![]() This course is in the Video On Demand format, to read about Video On Demand features click here.
This course is in the Video On Demand format, to read about Video On Demand features click here.

- Install on any SCORM LMS
- Full-screen video presentation
- Print certificate and wallet card
- You have 30 days to complete the course
Executives, business professionals, or any employees who wish to improve the visual aspects of their business data through Microsoft Excel
- Presenting Data Using Charts
- Creating a Chart
- Moving and Resizing Charts
- Changing Chart Type
- Formatting Charts
- Chart Data Ranges
- Format Axis
- Labels
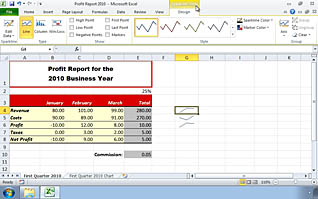
- Sparklines
© Mastery Technologies, Inc.


