Microsoft Excel 2016 Level 3.6: Forecasting Data
- Product ID
- sonie16fd_vod
- Training Time ?
- 18 to 24 minutes
- Language(s)
- English
- Video Format
- High Definition
- Required Plugins
- None
- Number of Lessons
- 4
- Quiz Questions
- 6
- Closed Captioning
- Question Feedback
- Wrong Answer Remediation
- Lesson Bookmarking
- Downloadable Resources


Knowing how to utilize data to predict future trends can be useful in business. This video training course is for employees to learn how to forecast data in Microsoft Excel 2016.
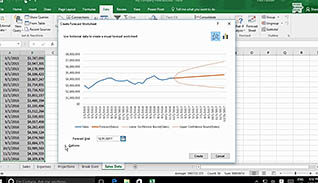
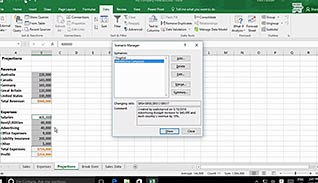
This video teaches viewers how to use data tables to create a what-if analysis. Viewers learn how to work with multiple variables using data scenarios. Finally, the course demonstrates how to visibly display data trends.
Use this video to educate employees about using Excel 2016’s data forecasting tools to create worksheets to help predict future trends.
![]() This course is in the Video On Demand format, to read about Video On Demand features click here.
This course is in the Video On Demand format, to read about Video On Demand features click here.

- Install on any SCORM LMS
- Full-screen video presentation
- Print certificate and wallet card
- You have 30 days to complete the course
All employees who use Excel 2016
- Determine Potential Outcomes Using Data Tables
- Determine Potential Outcomes Using Data Scenarios
- Use the Goal Seek Feature
- Forecast Data Trends
-
Determine potential outcomes using data tables.
- Identify what a one variable data table will project.
- Recall required selections for a two-variable data table.
-
Determine potential outcomes using data scenarios.
- Identify uses of data scenarios.
- Recall why it's important to save a copy of original formulas.
-
Use the Goal Seek feature.
- Identify the function of the Goal Seek feature.
-
Forecast data trends.
- Recall how the forecast sheet is viewed.
© Mastery Technologies, Inc.


